Page 102 - One Report Thai Final_ENG_2021
P. 102

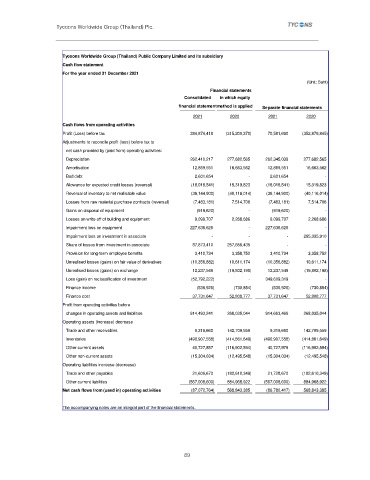
Tycoons Worldwide Group (Thailand) Plc.


                      Tycoons Worldwide Group (Thailand) Public Company Limited and its subsidiary
                      Cash flow statement
                      For the year ended 31 December 2021
                                                                                                       (Unit: Baht)
                                                                       Financial statements
                                                              Consolidated  in which equity
                                                            financial statementmethod is applied  Separate financial statements

                                                                 2021        2020         2021        2020
                      Cash flows from operating activities
                      Profit (Loss) before tax                         384,874,418         (315,200,370)             70,581,690         (352,879,845)
                      Adjustments to reconcile profit (loss) before tax to
                         net cash provided by (paid from) operating activities:
                         Depreciation                                  262,410,217           277,682,565           262,345,039           277,682,565
                         Amortisation                                   12,869,551             16,663,562             12,869,551             16,663,562
                         Bad debt                                         2,601,654                              -               2,601,654                            -

                         Allowance for expected credit losses (reversal)           (18,018,541)             15,319,823           (18,018,541)            15,319,823
                       Reversal of inventory to net realisable value            (36,144,900)           (40,116,014)           (36,144,900)           (40,116,014)
                       Losses from raw material purchase contracts (reversal)  (7,483,181)  7,514,706  (7,483,181)  7,514,706
                         Gains on disposal of equipment                     (919,620)                            -                  (919,620)                              -
                         Losses on write-off of building and equipment               9,099,707               2,268,686               9,099,707               2,268,686
                         Impairment loss on equipment                  227,636,626                              -           227,636,626                              -
                       Impairment loss on investment in associate                              -                             -                             -           295,335,910
                         Share of losses from investment in associate             87,873,410           257,656,435                             -                             -
                         Provision for long-term employee benefits               3,410,734               3,358,752               3,410,734               3,358,752
                         Unrealised losses (gains) on fair value of derivatives           (10,356,882)             10,611,174           (10,356,882)              10,611,174
                         Unrealised losses (gains) on exchange             12,237,549           (19,802,198)             12,237,549           (19,802,198)
                         Loss (gain) on reclassification of investment           (52,792,222)                              -           349,609,319                              -
                         Finance income                                     (536,926)                (730,854)                (536,926)                (730,854)
                         Finance cost                                   37,731,647             52,808,777             37,731,647             52,808,777
                      Profit from operating activities before
                         changes in operating assets and liabilities          914,493,241           268,035,044           914,663,466           268,035,044

                      Operating assets (increase) decrease
                         Trade and other receivables                      9,319,660           142,709,559                9,319,660           142,709,559
                         Inventories                                 (490,907,558)         (414,861,649)         (490,907,558)         (414,861,649)
                         Other current assets                           40,727,857         (116,902,594)             40,727,979         (116,902,594)
                         Other non-current assets                      (15,304,034)           (12,495,548)           (15,304,034)           (12,495,548)
                      Operating liabilities increase (decrease)
                         Trade and other payables                       21,606,670         (182,610,349)             21,728,670         (182,610,349)
                         Other current liabilities                   (567,008,600)            884,968,922         (567,008,600)            884,968,922
                      Net cash flows from (used in) operating activities           (87,072,764)           568,843,385           (86,780,417)           568,843,385


                      The accompanying notes are an integral part of the financial statements.


                                                              89
   97   98   99   100   101   102   103   104   105   106   107