
Page 112 - TYCONS - ANNUAL REPORT 2022
P. 112
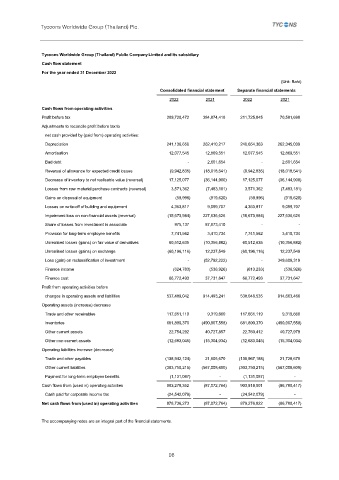
Tycoons Worldwide Group (Thailand) Plc.


                Tycoons Worldwide Group (Thailand) Public Company Limited and its subsidiary
                Cash flow statement
                For the year ended 31 December 2022
                                                                                                    (Unit: Baht)
                                                         Consolidated financial statement  Separate financial statements
                                                             2022        2021         2022          2021
                Cash flows from operating activities
                Profit before tax                                 209,720,472           384,874,418           211,725,845              70,581,690
                Adjustments to reconcile profit before tax to
                   net cash provided by (paid from) operating activities:
                   Depreciation                                   241,136,656           262,410,217           240,654,363           262,345,039
                   Amortisation                                     12,077,545             12,869,551             12,077,545              12,869,551
                   Bad debt                                                          -               2,601,654                            -                 2,601,654
                   Reversal of allowance for expected credit losses              (9,942,835)           (18,018,541)             (9,942,835)           (18,018,541)
                   Decrease of inventory to net realisable value (reversal)             17,125,077            (36,144,900)             17,125,077          (36,144,900)

                   Losses from raw material purchase contracts (reversal)  3,571,362  (7,483,181)  3,571,362  (7,483,181)
                   Gains on disposal of equipment                        (59,996)                (919,620)                  (59,996)                (919,620)
                   Losses on write-off of building and equipment               4,353,817               9,099,707               4,353,817               9,099,707
                   Impairment loss on non-financial assets (reversal)          (15,673,984)          227,636,626          (15,673,984)           227,636,626


                   Share of losses from investment in associate                  975,137             87,873,410                              -                            -
                   Provision for long-term employee benefits               7,741,562               3,410,734               7,741,562               3,410,734

                   Unrealised losses (gains) on fair value of derivatives             60,512,635            (10,356,882)             60,512,635          (10,356,882)


                   Unrealised losses (gains) on exchange          (60,196,116)              12,237,549          (60,196,116)              12,237,549
                   Loss (gain) on reclassification of investment                              -           (52,792,222)                              -           349,609,319

                   Finance income                                     (624,783)                (536,926)                (613,233)                (536,926)
                   Finance cost                                     66,772,493             37,731,647             66,772,493              37,731,647
                Profit from operating activities before
                   changes in operating assets and liabilities           537,489,042           914,493,241           538,048,535           914,663,466
                Operating assets (increase) decrease
                   Trade and other receivables                    117,651,119               9,319,660           117,651,119               9,319,660
                   Inventories                                    681,890,370        (490,907,558)           681,890,370         (490,907,558)


                   Other current assets                             22,754,292             40,727,857             22,760,412            40,727,979
                   Other non-current assets                      (12,683,045)           (15,304,034)           (12,683,045)           (15,304,034)

                Operating liabilities increase (decrease)

                   Trade and other payables                      (138,942,124)              21,606,670        (138,967,188)            21,728,670

                   Other current liabilities                    (303,750,215)         (567,008,600)         (303,750,215)         (567,008,600)
                   Payment for long-term employee benefits             (1,131,087)                         -             (1,131,087)                         -
                Cash flows from (used in) operating activities           903,278,352           (87,072,764)           903,818,901           (86,780,417)
                   Cash paid for corporate income tax             (24,542,079)                         -           (24,542,079)                         -


                Net cash flows from (used in) operating activities          878,736,273          (87,072,764)           879,276,822            (86,780,417)
                The accompanying notes are an integral part of the financial statements.


                                                            98