
Page 38 - One Report Thai Final_ENG_2021
P. 38
Tycoons Worldwide Group (Thailand) Plc.
1. Energy management
1.1 Fuel consumption
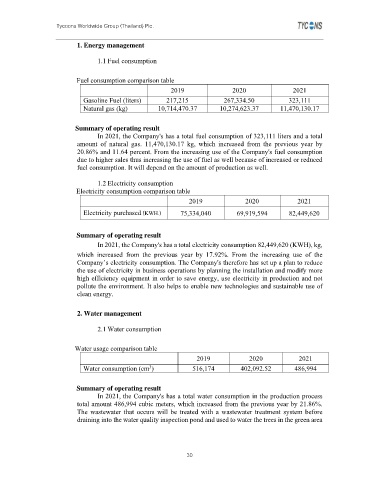
Fuel consumption comparison table
2019 2020 2021
Gasoline Fuel (liters) 217,215 267,334.50 323,111
Natural gas (kg) 10,714,470.37 10,274,623.37 11,470,130.17
Summary of operating result
In 2021, the Company's has a total fuel consumption of 323,111 liters and a total
amount of natural gas. 11,470,130.17 kg, which increased from the previous year by
20.86% and 11.64 percent. From the increasing use of the Company's fuel consumption
due to higher sales thus increasing the use of fuel as well because of increased or reduced
fuel consumption. It will depend on the amount of production as well.
1.2 Electricity consumption
Electricity consumption comparison table
2019 2020 2021
Electricity purchased (KWH.) 75,334,040 69,919,594 82,449,620
Summary of operating result
In 2021, the Company's has a total electricity consumption 82,449,620 (KWH), kg,
which increased from the previous year by 17.92%. From the increasing use of the
Company’s electricity consumption. The Company's therefore has set up a plan to reduce
the use of electricity in business operations by planning the installation and modify more
high efficiency equipment in order to save energy, use electricity in production and not
pollute the environment. It also helps to enable new technologies and sustainable use of
clean energy.
2. Water management
2.1 Water consumption
Water usage comparison table
2019 2020 2021
3
Water consumption (cm ) 516,174 402,092.52 486,994
Summary of operating result
In 2021, the Company's has a total water consumption in the production process
total amount 486,994 cubic meters, which increased from the previous year by 21.86%.
The wastewater that occurs will be treated with a wastewater treatment system before
draining into the water quality inspection pond and used to water the trees in the green area
30