
Page 52 - One Report Thai Final_ENG_2021
P. 52
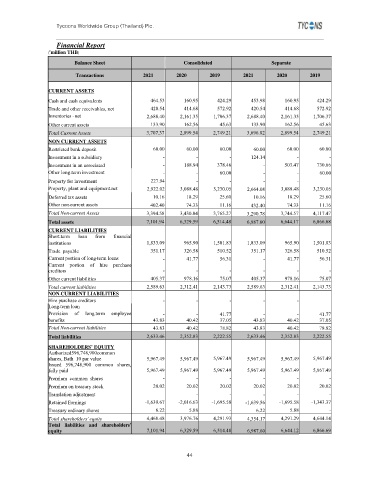
Tycoons Worldwide Group (Thailand) Plc.


                    Financial Report
                 ('million THB)

                          Balance Sheet                       Consolidated                 Separate
                          Transactions          2021       2020       2019       2021        2020       2019

                 CURRENT ASSETS
                 Cash and cash equivalents         464.53     160.95     424.29     453.98     160.95     424.29
                 Trade and other receivables, net    420.54   414.68     572.92     420.54     414.68     572.92
                 Inventories - net                2,688.40   2,161.35   1,706.37   2,688.40   2,161.35   1,706.37
                 Other current assets              133.90     162.56      45.63     133.90     162.56      45.63
                 Total Current Assets             3,707.37   2,899.54   2,749.21   3,696.82   2,899.54   2,749.21
                 NON CURRENT ASSETS
                 Restricted bank deposit            60.00      60.00      60.00      60.00      60.00      60.00
                 Investment in a subsidiary            -          -          -      124.14         -          -
                 Investment in an associated           -      188.94     378.46         -      503.47     730.66
                 Other long-term investment            -          -       60.00         -          -       60.00
                 Property for investment           227.94         -          -          -          -
                 Property, plant and equipment-net   2,922.02  3,088.48  3,230.05  2,664.08   3,088.48   3,230.05
                 Deferred tax assets                10.16      18.29      25.60      10.16      18.29      25.60
                 Other non-current assets          402.40      74.33      11.16     432.40      74.33      11.16
                 Total Non-current Assets         3,394.58   3,430.04   3,765.27   3,290.78   3,744.57   4,117.47
                 Total assets                     7,101.94   6,329.59   6,514.48   6,987.60   6,644.17   6,866.68
                 CURRENT LIABILITIES
                 Short-term  loan  from  financial
                 institutions                     1,833.09    965.90    1,501.83   1,833.09    965.90    1,501.83
                 Trade  payable                    351.17     326.58     510.52     351.17     326.58     510.52
                 Current portion of long-term loans    -       41.77      56.31         -       41.77      56.31
                 Current portion  of hire purchase
                 creditors                             -          -          -          -          -          -
                 Other current liabilities         405.37     978.16      75.07     405.37     978.16      75.07
                 Total current liabilities        2,589.63   2,312.41   2,143.73   2,589.63   2,312.41   2,143.73
                 NON-CURRENT LIABILITIES
                 Hire purchase creditors               -          -          -          -          -
                 Long-term loan
                 Provision  of  long-term  employee    -          -       41.77         -          -       41.77
                 benefits                           43.83      40.42      37.05      43.83      40.42      37.05
                 Total Non-current liabilities      43.83      40.42      78.82      43.83      40.42      78.82
                 Total liabilities                2,633.46   2,352.83   2,222.55   2,633.46   2,352.83   2,222.55
                 SHAREHOLDERS’ EQUITY
                 Authorized596,748,900common
                 shares, Bath  10 par value       5,967.49   5,967.49   5,967.49   5,967.49   5,967.49   5,967.49
                 Issued 596,748,900 common shares,
                 fully paid                       5,967.49   5,967.49   5,967.49   5,967.49   5,967.49   5,967.49
                 Premium  common  shares               -          -          -          -          -          -
                 Premium on treasury stock          20.02      20.02      20.02      20.02      20.02      20.02
                 Translation adjustment                           -          -          -          -          -
                 Retained Earnings               -1,639.67  -2,016.63  -1,695.58  -1,639.56  -1,695.58  -1,343.37
                 Treasury ordinary shares            6.22       5.88         -        6.22       5.88         -
                 Total shareholders' equity       4,468.48   3,976.76   4,291.93   4,354.17   4,291.29   4,644.14
                 Total  liabilities and shareholders'
                 equity                           7,101.94   6,329.59   6,514.48   6,987.60   6,644.12   6,866.69


                                                               44