Page 54 - One Report Thai Final_ENG_2021
P. 54

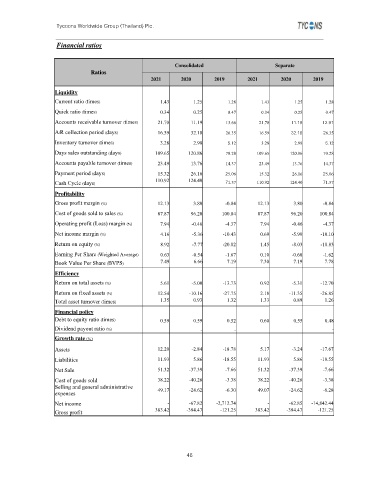
Tycoons Worldwide Group (Thailand) Plc.


                    Financial ratios


                                                           Consolidated                     Separate
                               Ratios
                                                   2021      2020       2019       2021       2020       2019
                   Liquidity
                   Current ratio (times)              1.43       1.25       1.28       1.43       1.25       1.28
                   Quick ratio (times)                0.34       0.25       0.47       0.34       0.25       0.47
                   Accounts receivable turnover (times)   21.70  11.19      13.66      21.70     11.19      12.91

                   A/R collection period (days)      16.59      32.18       26.35      16.59     32.18      26.35
                   Inventory turnover (times)         3.28       2.98       5.12       3.28       2.98       5.12
                   Days sales outstanding (days)    109.65     120.86       70.28     109.65     120.86     70.28
                   Accounts payable turnover (times)   23.49    13.76       14.37      23.49      13.76     14.37
                   Payment period (days)             15.32      26.16       25.06      15.32      26.16     25.06
                                                    110.92     124.40       71.57     110.92     124.40     71.57
                   Cash Cycle (days)
                   Profitability
                   Gross profit margin (%)           12.13       3.80       -0.84     12.13       3.80      -0.84
                   Cost of goods sold to sales (%)   87.87      96.20     100.84      87.87      96.20     100.84
                   Operating profit (Loss) margin (%)   7.94    -0.46       -4.37      7.94       -0.46     -4.37

                   Net income margin (%)              4.16       -5.36     -10.43      0.69       -5.99    -10.10
                   Return on equity (%)               8.92       -7.77     -20.82      1.45       -8.03    -18.83
                   Earning Per Share (Weighted Average)   0.63   -0.54      -1.67      0.10       -0.60     -1.62
                   Book Value Per Share (BVPS)        7.49       6.66       7.19       7.30       7.19      7.78
                   Efficiency
                   Return on total assets (%)         5.61      -5.00      -13.73      0.92       -5.31    -12.70
                   Return on fixed assets (%)        12.54      -10.16     -27.75      2.18      -11.35    -26.85
                   Total asset turnover (times)       1.35       0.93       1.32       1.33       0.89      1.26
                   Financial policy
                   Debt to equity ratio (times)       0.59       0.59       0.52       0.60       0.55      0.48
                   Dividend payout ratio (%)                       -           -                               -
                   Growth rate (%)

                   Assets                            12.20      -2.84      -18.78      5.17       -3.24    -17.67
                   Liabilities                       11.93       5.86      -18.55     11.93       5.86     -18.55
                   Net Sale                          51.32      -37.39      -7.66     51.32      -37.39     -7.66
                   Cost of goods sold                38.22      -40.26      -3.38     38.22      -40.26     -3.38
                   Selling and general administrative
                   expenses                          49.17      -24.62      -6.30     49.07      -24.62     -6.28

                   Net income                           -       -67.82   -2,712.74        -      -62.85  -14,842.44
                   Gross profit                     383.42     -384.47    -121.25    383.42     -384.47   -121.25


                                                               46
   49   50   51   52   53   54   55   56   57   58   59