
Page 55 - TYCONS - ANNUAL REPORT 2022
P. 55
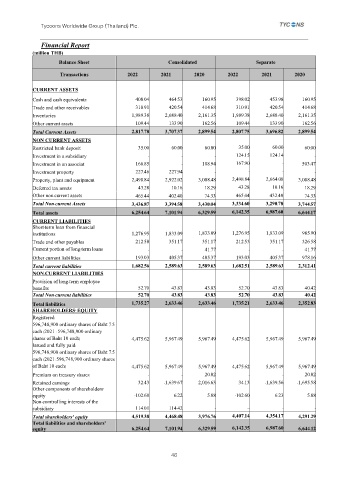
Tycoons Worldwide Group (Thailand) Plc.


               Financial Report
            (million THB)

                      Balance Sheet                         Consolidated                   Separate

                      Transactions            2022        2021       2020        2022        2021       2020

            CURRENT ASSETS
            Cash and cash equivalents            408.04     464.53      160.95      398.02      453.98     160.95
            Trade and other receivables          310.91     420.54      414.68      310.91      420.54     414.68
            Inventories                        1,989.38    2,688.40    2,161.35    1,989.38   2,688.40    2,161.35
            Other current assets                 109.44     133.90      162.56      109.44      133.90     162.56
            Total Current Assets               2,817.78    3,707.37    2,899.54    2,807.75   3,696.82    2,899.54
            NON CURRENT ASSETS
            Restricted bank deposit               35.00      60.00       60.00       35.00       60.00      60.00
            Investment in a subsidiary               -           -          -       124.15      124.14         -
            Investment in an associat            166.85          -      188.94      167.90          -      503.47
            Investment property                  227.46     227.94          -           -           -           -
            Property, plant and equipment      2,498.84    2,922.02    3,088.48    2,498.84   2,664.08    3,088.48
            Deferred tax assets                   43.28      10.16       18.29       43.28       10.16      18.29
            Other non-current assets             465.44     402.40       74.33      465.44      432.40      74.33
            Total Non-current Assets           3,436.87    3,394.58    3,430.04    3,334.60   3,290.78    3,744.57
            Total assets                       6,254.64    7,101.94    6,329.59    6,142.35   6,987.60    6,644.17
            CURRENT LIABILITIES
            Short-term loan from financial
            institutions                       1,276.95    1,833.09    1,833.09    1,276.95   1,833.09     965.90
            Trade and other payables             212.58     351.17      351.17      212.53      351.17     326.58
            Current portion of long-term loans       -           -       41.77          -           -       41.77
            Other current liabilities            193.03     405.37      405.37      193.03      405.37     978.16
            Total current liabilities          1,682.56    2,589.63    2,589.63    1,682.51   2,589.63    2,312.41
            NON-CURRENT LIABILITIES
            Provision of long-term employee
            benefits                              52.70      43.83       43.83       52.70       43.83      40.42
            Total Non-current liabilities         52.70      43.83       43.83       52.70       43.83      40.42
            Total liabilities                  1,735.27    2,633.46    2,633.46    1,735.21   2,633.46    2,352.83
            SHAREHOLDERS’ EQUITY
            Registered:
            596,748,900 ordinary shares of Baht 7.5
            each (2021 : 596,748,900 ordinary
            shares of Baht 10 each)            4,475.62    5,967.49    5,967.49    4,475.62   5,967.49    5,967.49
            Issued and fully paid:
            596,748,900 ordinary shares of Baht 7.5
            each (2021: 596,748,900 ordinary shares
            of Baht 10 each)                   4,475.62    5,967.49    5,967.49    4,475.62   5,967.49    5,967.49
            Premium on treasury shares               -           -       20.02          -           -       20.02
            Retained earnings                     32.43    -1,639.67   2,016.63      34.13    -1,639.56  -1,695.58
            Other components of shareholders’
            equity                              -102.68       6.22        5.88      -102.60       6.23       5.88
            Non-comtrolling interests of the
            subsidiary                           114.01     114.42          -           --          -           -
            Total shareholders' equity         4,519.38    4,468.48    3,976.76    4,407.14   4,354.17    4,291.29
            Total liabilities and shareholders'
            equity                             6,254.64    7,101.94    6,329.59    6,142.35   6,987.60    6,644.12


                                                             46