
Page 56 - TYCONS - ANNUAL REPORT 2022
P. 56
Tycoons Worldwide Group (Thailand) Plc.
Income statement and Cash flow
(million THB)
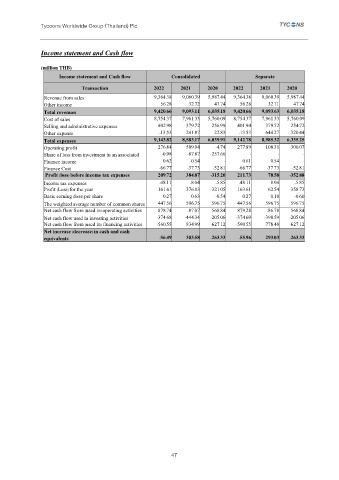
Income statement and Cash flow Consolidated Separate
Transaction 2022 2021 2020 2022 2021 2020
Revenue from sales 9,364.38 9,060.39 5,987.44 9,364.38 9,060.39 5,987.44
Other income 56.28 32.72 47.74 56.28 32.71 47.74
Total revenues 9,420.66 9,093.11 6,035.18 9,420.66 9,093.63 6,035.18
Cost of sales 8,754.37 7,961.33 5,760.09 8,754.37 7,961.33 5,760.09
Selling and administrative expenses 402.98 379.72 256.99 401.94 379.72 254.72
Other expense -13.53 241.87 22.83 -13.53 644.27 320.44
Total expenses 9,143.82 8,583.17 6,039.91 9,142.78 8,985.32 6,335.25
Operating profit 276.84 509.94 -4.74 277.89 108.31 -300.07
Share of loss from investment in an associated -0.98 -87.87 -257.66 - - -
Finance income 0.62 0.54 - 0.61 0.54 -
Finance Cost -66.77 -37.73 -52.81 -66.77 -37.73 -52.81
Profit (loss) before income tax expenses 209.72 384.87 -315.20 211.73 70.58 -352.88
Income tax expenses -48.11 -8.04 -5.85 -48.11 8.04 -5.85
Profit (Loss) for the year 161.61 376.83 -321.05 163.61 62.54 -358.73
Basic earning (loss) per share 0.27 0.63 -0.54 0.27 0.10 -0.60
The weighted average number of common shares 447.56 596.75 596.75 447.56 596.75 596.75
Net cash flow from (used in) operating activities 878.74 -87.07 568.84 879.28 -86.78 568.84
Net cash flow used in investing activities -374.68 -444.34 -205.06 -374.69 -398.59 -205.06
Net cash flow from (used in) financing activities -560.55 834.99 -627.12 -590.55 778.40 -627.12
Net increase (decrease) in cash and cash
equivalents -56.49 303.58 -263.33 -55.96 293.03 -263.33
47